Reliability·n8n workflow
Cloud Log Anomaly Detector
Every 10 minutes: measure cloud log volume, detect spikes (>2x baseline), LLM analyzes top errors and likely cause — alert to #log-alerts.
Overview
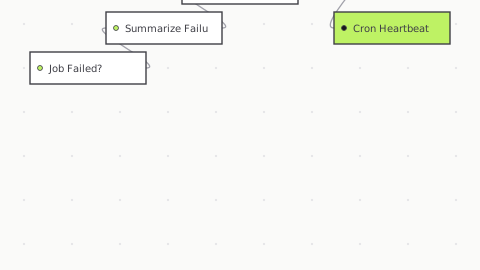
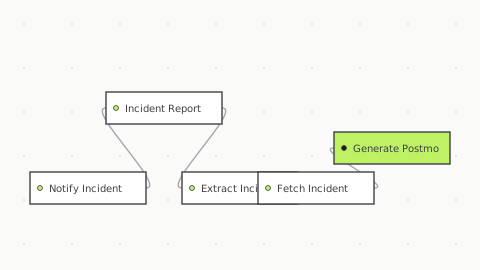
What it does: Schedule (every 10 min) → query cloud logs (AWS CloudWatch, GCP Cloud Logging, Azure Monitor) for error rate/volume → code detects anomaly: current > 2x baseline? → IF spike → fetch top errors + services generating them → LLM diagnoses (which service failing, error type, severity: cascade, new bug, traffic spike) → Slack to #log-alerts.
Setup (4 steps)
01
Connect cloud logs: AWS CloudWatch, GCP Cloud Logging, Azure Monitor (API endpoint + credentials)
02
Set baseline: measure normal error rate (automatic rolling 7-day avg)
03
Configure spike threshold: multiplier (default 2x = 100% increase)
04
Set Slack channel: #log-alerts
Apps/nodes: Schedule, HTTP request (logs API), code node (anomaly math), Claude/OpenAI (diagnosis), Slack.
Credentials required: Cloud logs API key, OpenAI account, Slack workspace.
Difficulty: Easy | Setup time: 6 minutes.
Business outcome: Catches error cascades, service issues, traffic spikes instantly → incident response ↑ faster, MTTR ↓ 50%.
What's included
Importable n8n workflow (JSON)
Workflow nodes and configuration — inspect triggers, logic, and actions
Setup notes: which credentials to connect
Free updates when the workflow changes
Commercial-use license — keep and customize
Email support if you get stuck
Inside this workflow
7 steps · 6 unique directed pathsFocus a node to inspect it
Quickstart
- 01
Download the JSON
With an active subscription, download the workflow file right from this page or your dashboard.
- 02
Import into n8n
Choose Import from File and select the downloaded JSON. The full agent graph appears, ready to configure.
- 03
Plug in credentials
Each integration node prompts for credentials on first run. The setup guide lists every credential the agent expects.
- 04
Activate and test
Run once with sample input, confirm the expected output, then flip the activate toggle.
Frequently Asked Questions
How do I import this workflow into n8n?
What credentials do I need to provide?
Are the credentials included in the JSON file?
Can I edit or customize the workflow after importing?
What n8n version is required?
What if something breaks after I import it?
Can I use this workflow for my customers or business?
Will the workflow receive updates?
Do I need n8n Pro or a paid plan?
Can I ask for a custom workflow?
Reviews (0)
No reviews yet. Be the first.
Sign in to leave a review.
Subscription
Included with subscription
This agent — and every other in the collection — comes with your subscription. One plan, the whole catalog.
Subscribe to download- Full collection access — every agent
- All new workflows as released
- Unlimited downloads
- Commercial-use license
- Priority support (Team plan)
- Cancel anytime